A few days ago the Rudd government in Australia decided to end mandatory detention for asylum seekers while their applications for asylum are processed. This can be a very long process, often taking years.
This is great news; it ends a period of appalling treatment of people who in many cases have already suffered a great deal.
Thursday, July 31, 2008
Thursday, July 24, 2008
Unasking the question
The problem with asking a theist to give evidence for a God is not so much the fact that they lack evidence.
It's that they don't seem to have a coherent concept of what they mean when they say the word. The God concept slips around in any argument - one moment its one thing, the next moment it's some other, contradictory thing.
(And woe betide anyone should they dare ask for a coherent definition! Your likely fate is to be buried under increasingly thick layers of blather, each one getting further from any sense of definition.)
I have come to think "God" is not a concept in the usual sense. It's a bag for holding and dealing with a large pile of (often conflicting) emotions, with a vaguely concept-like structure imposed on it by hundreds of generations of talking about it.
I wonder if perhaps the debate should shift. We should unask "What evidence is there?", and instead we should perhaps be saying "You keep using that word - what do you think it means?".
If you can get an answer that sounds like it means anything whatever ask "Umm, can we write that definition down, please?"
You still won't get any evidence, of course, but maybe you can get them to talk about the one damn conception of God for more than one sentence at a time.
Well, it depends on what the meaning of "is" is.
Wednesday, July 23, 2008
The parable of the histogram
I must be some kind of heretic. I'm a statistician, and here I am pointing out the problems in yet another common statistical tool.
We'll see how the histogram, which is a very popular way of displaying the distributional shape of a set of data, must be viewed with a good deal of caution.
Even though histograms are often found in the media, the problems with histograms are almost unknown among the general public. Indeed, most places that teach statistics at university completely fail to mention them.
I'd like to say that the problems are well known among professional statisticians, but that might be too strong. Certainly problems have been pointed out in the literature, and many statisticians are aware of the problems, but it seems many still are not, and the appropriate cautions are not always explained.
I'm going to show you a simple example.
Here's some data (40 observations in this sample), which I'm going to draw a histogram of. I have rounded the numbers off to two decimal places.
I give the numbers so you can (if you are so inclined) confirm for yourself what I will tell you in my little parable.
(Edit added Feb 2012: I noticed that the results didn't quite reproduce in R - three observations in the original data set I gave occurred exactly on bin boundaries for some situations. This was either a problem caused by rounding, or possibly by different conventions of different packages for handling observations at bin boundaries; I have accordingly altered those three observations by tiny amounts to move them off boundaries and avoid the issue, whatever its source. There is R code at the end of the post that works.)
The parable
This data set was given to a student, Annie. She constructs her histogram of the data by counting the number of values between 0 and 1 (but not including exactly 1), between 1 and 2, and so on, and then drawing a series of boxes each of whose base covers the subset of values that the count came from and whose height is the count for that range of values. Annie's histogram is shown in the top-left of the picture below.
She obtains a histogram whose shape corresponds to a distribution that is skewed to the left. See, for example, this description of using histograms to assess distributional shape here (edit: broken link replaced with an alternative) - that's pretty much precisely the way many elementary books on statistics describe the way to assess the shape of a distribution (and usually it's going to give you the right sort of impression).
Note that I could remove the scale and I could still describe the shape - I don't need to know the numbers on the scale in order to arrive at my description.
Three of Annie's friends, Brian, Chris and Zoe (Hah! Psych!) also get data sets with 40 observations, and they all do exactly as Annie did. Their histograms are given below (Annie's data is V1, Brian's is V2 and so on).
 (click pic for a larger image)
Correspondingly, Brian describes his distribution as symmetric (and he might add "uniform"). Chris describes his as skewed to the right. Zoe describes hers as symmetric and bimodal (it has two main peaks).
So far so good - this is exactly how the books tell you it all works.
So while they're comparing their histograms, Annie idly starts looking at Brian's actual numbers. She realizes something odd is going on. She quickly places all their data sets side-by-side.
"Look, Chris!" Annie says, "all Brian's values are smaller than mine by 0.25. All yours are a quarter smaller than Brian's, and Zoe's are a quarter smaller than yours!"
They all confirm that she is correct - each set of values is the same, but with its origin merely shifted a little. Their data sets are identical in shape, but the resulting histograms are not.
That is to say, assessment of distributional shape in histograms can be dramatically affected by choice of scale (specifically, by the choice of the origin and width of the histgram bins). Here ends the parable.
It usually isn't this dramatic, of course, but the fact is, if one can generate a seemingly innocuous set of numbers whose histogram will look completely different (and for which many people will assert the distributional shape is completely different) every time we merely add or subtract a quarter, it can happen with real data too. And it does happen. Mostly the difference in impression is more modest... but not always.
So if you see a histogram, just keep in the back of your mind that it's perfectly possible that a different choice of bin boundaries would yield a somewhat different impression of the data.
Imagine I want to show some students that I write "easy" tests (I don't know why this should be such an object of fascination for students since they all do the same test, and marks are generally scaled, but it is). In preparation, I draw a histogram and it turns out to like Chris' - it looks like most students score below the middle of the range of marks. But lo, I discover with a bit of fiddling around that if I make my bin centres where the edges were (and so on), the completely opposite impression is given - just like Annie's histogram. Yay, "easy test" ... and many fewer worried queries from students in the run-up to the test, because they tend to feel there's a good chance of scoring "above the middle".
Did I lie? No. Did I fudge the data? Well, no. I did something, though. Or rather, I didn't do something.
This is a sin of omission. I fail to explain what the data would have looked like given a different choice of bin location.
Clearly, when circumstances are right, the ability to choose the location and width of the bins can give us the opportunity to somewhat alter the impression given by a histogram. Without fudging the numbers themselves, we can sometimes fudge the impression they give.
What do statisticians do? Well, there are other ways to look at distributional shape. Kernel density estimates are popular, and they completely get rid of the "bin-location" issue, though there's still the equivalent of a "bin-width" issue (choice of bandwidth, also called the "window"), which is often dealt with by looking at more than one choice of width (usually a width that gives a nice smooth result and then one that is smaller, giving a "rougher" result, in order that we can see there's nothing unsual hiding away - like the blue and green curves in the graph at topleft right** at the wikipedia link a few lines up). But there are a variety of other tools that might be used (which I don't plan on going into here).
**(did I ever mention that I have trouble with correctly attributing the words "left" and "right"? - well as you see, sometimes I do. But not when describing the shape of a distribution, isn't that odd?)
What can you do? Well, assuming you don't have anything more sophisticated that a basic histogram tool, at the least (with continuous data, anyway), try shifting your bin starts forward or back a fraction of a bin-width (if you're lazy, maybe try something near a half, otherwise maybe try a couple of values). Also try a narrower bin width. If you do a few different histograms that all give the same general impression, it doesn't matter much which one you use. And if they don't give the same impression, you better either say so, show more than one, or find some other way to convey the information.
[Or you can do a kernel density estimate readily enough - many packages (including some free ones) will do them; there are pages online that can draw them if you just paste in some data. Implementing a kernel density estimate of your own is fairly straightforward - you can compute one in a spreadsheet easily enough - if anything, it's probably slightly simpler to compute one than it is to compute counts for a histogram, which is in itself pretty straightforward. ]
Caveat Emptor
___
Added in edit in Feb 2012:
Here is some R code to create the data:
Here is some R code to generate the histograms:
Here is some R code to generate some density estimates:
Here is some R code to generate some other informative displays:
First - the sample cumulative distribution function
Second, a stripchart that shows the positions of the individual observations as they move back.
We'll see how the histogram, which is a very popular way of displaying the distributional shape of a set of data, must be viewed with a good deal of caution.
Even though histograms are often found in the media, the problems with histograms are almost unknown among the general public. Indeed, most places that teach statistics at university completely fail to mention them.
I'd like to say that the problems are well known among professional statisticians, but that might be too strong. Certainly problems have been pointed out in the literature, and many statisticians are aware of the problems, but it seems many still are not, and the appropriate cautions are not always explained.
I'm going to show you a simple example.
Here's some data (40 observations in this sample), which I'm going to draw a histogram of. I have rounded the numbers off to two decimal places.
3.15 2.28 2.06 3.43 4.85 3.22 4.01 4.43
5.46 3.12 5.53 5.51 5.56 5.52 5.31 4.96
3.28 4.10 5.19 2.54 1.89 1.84 2.56 1.90
4.20 3.42 2.39 3.64 4.84 4.31 5.11 5.60
1.98 3.91 1.88 4.33 5.74 2.01 2.58 1.92
I give the numbers so you can (if you are so inclined) confirm for yourself what I will tell you in my little parable.
(Edit added Feb 2012: I noticed that the results didn't quite reproduce in R - three observations in the original data set I gave occurred exactly on bin boundaries for some situations. This was either a problem caused by rounding, or possibly by different conventions of different packages for handling observations at bin boundaries; I have accordingly altered those three observations by tiny amounts to move them off boundaries and avoid the issue, whatever its source. There is R code at the end of the post that works.)
The parable
This data set was given to a student, Annie. She constructs her histogram of the data by counting the number of values between 0 and 1 (but not including exactly 1), between 1 and 2, and so on, and then drawing a series of boxes each of whose base covers the subset of values that the count came from and whose height is the count for that range of values. Annie's histogram is shown in the top-left of the picture below.
She obtains a histogram whose shape corresponds to a distribution that is skewed to the left. See, for example, this description of using histograms to assess distributional shape here (edit: broken link replaced with an alternative) - that's pretty much precisely the way many elementary books on statistics describe the way to assess the shape of a distribution (and usually it's going to give you the right sort of impression).
Note that I could remove the scale and I could still describe the shape - I don't need to know the numbers on the scale in order to arrive at my description.
Three of Annie's friends, Brian, Chris and Zoe (Hah! Psych!) also get data sets with 40 observations, and they all do exactly as Annie did. Their histograms are given below (Annie's data is V1, Brian's is V2 and so on).
 (click pic for a larger image)
Correspondingly, Brian describes his distribution as symmetric (and he might add "uniform"). Chris describes his as skewed to the right. Zoe describes hers as symmetric and bimodal (it has two main peaks).
So far so good - this is exactly how the books tell you it all works.
So while they're comparing their histograms, Annie idly starts looking at Brian's actual numbers. She realizes something odd is going on. She quickly places all their data sets side-by-side.
"Look, Chris!" Annie says, "all Brian's values are smaller than mine by 0.25. All yours are a quarter smaller than Brian's, and Zoe's are a quarter smaller than yours!"
They all confirm that she is correct - each set of values is the same, but with its origin merely shifted a little. Their data sets are identical in shape, but the resulting histograms are not.
That is to say, assessment of distributional shape in histograms can be dramatically affected by choice of scale (specifically, by the choice of the origin and width of the histgram bins). Here ends the parable.
It usually isn't this dramatic, of course, but the fact is, if one can generate a seemingly innocuous set of numbers whose histogram will look completely different (and for which many people will assert the distributional shape is completely different) every time we merely add or subtract a quarter, it can happen with real data too. And it does happen. Mostly the difference in impression is more modest... but not always.
So if you see a histogram, just keep in the back of your mind that it's perfectly possible that a different choice of bin boundaries would yield a somewhat different impression of the data.
Imagine I want to show some students that I write "easy" tests (I don't know why this should be such an object of fascination for students since they all do the same test, and marks are generally scaled, but it is). In preparation, I draw a histogram and it turns out to like Chris' - it looks like most students score below the middle of the range of marks. But lo, I discover with a bit of fiddling around that if I make my bin centres where the edges were (and so on), the completely opposite impression is given - just like Annie's histogram. Yay, "easy test" ... and many fewer worried queries from students in the run-up to the test, because they tend to feel there's a good chance of scoring "above the middle".
Did I lie? No. Did I fudge the data? Well, no. I did something, though. Or rather, I didn't do something.
This is a sin of omission. I fail to explain what the data would have looked like given a different choice of bin location.
Clearly, when circumstances are right, the ability to choose the location and width of the bins can give us the opportunity to somewhat alter the impression given by a histogram. Without fudging the numbers themselves, we can sometimes fudge the impression they give.
What do statisticians do? Well, there are other ways to look at distributional shape. Kernel density estimates are popular, and they completely get rid of the "bin-location" issue, though there's still the equivalent of a "bin-width" issue (choice of bandwidth, also called the "window"), which is often dealt with by looking at more than one choice of width (usually a width that gives a nice smooth result and then one that is smaller, giving a "rougher" result, in order that we can see there's nothing unsual hiding away - like the blue and green curves in the graph at top
**(did I ever mention that I have trouble with correctly attributing the words "left" and "right"? - well as you see, sometimes I do. But not when describing the shape of a distribution, isn't that odd?)
What can you do? Well, assuming you don't have anything more sophisticated that a basic histogram tool, at the least (with continuous data, anyway), try shifting your bin starts forward or back a fraction of a bin-width (if you're lazy, maybe try something near a half, otherwise maybe try a couple of values). Also try a narrower bin width. If you do a few different histograms that all give the same general impression, it doesn't matter much which one you use. And if they don't give the same impression, you better either say so, show more than one, or find some other way to convey the information.
[Or you can do a kernel density estimate readily enough - many packages (including some free ones) will do them; there are pages online that can draw them if you just paste in some data. Implementing a kernel density estimate of your own is fairly straightforward - you can compute one in a spreadsheet easily enough - if anything, it's probably slightly simpler to compute one than it is to compute counts for a histogram, which is in itself pretty straightforward. ]
Caveat Emptor
___
Added in edit in Feb 2012:
Here is some R code to create the data:
histdata <- c(3.15,5.46,3.28,4.2,1.98,2.28,3.12,4.1,3.42,3.91,2.06,5.53
,5.19,2.39,1.88,3.43,5.51,2.54,3.64,4.33,4.85,5.56,1.89,4.84,5.74,3.22
,5.52,1.84,4.31,2.01,4.01,5.31,2.56,5.11,2.58,4.43,4.96,1.9,5.6,1.92)
Here is some R code to generate the histograms:
opar<-par()
par(mfrow=c(2,2))
hist(histdata,breaks=1:6,main="Annie",xlab="V1",col="lightblue")
hist(histdata-0.25,breaks=1:6,main="Brian",xlab="V2",col="lightblue")
hist(histdata-0.5,breaks=1:6,main="Chris",xlab="V3",col="lightblue")
hist(histdata-0.75,breaks=1:6,main="Zoe",xlab="V4",col="lightblue")
par(opar)
Here is some R code to generate some density estimates:
opar<-par()
par(mfrow=c(2,2))
plot(density(histdata,bw=.2),main="Annie")
plot(density(histdata-.25,bw=.2),main="Brian")
plot(density(histdata-.5,bw=.2),main="Chris")
plot(density(histdata-.75,bw=.2),main="Zoe")
par(opar)
Here is some R code to generate some other informative displays:
First - the sample cumulative distribution function
plot(ecdf(histdata))
Second, a stripchart that shows the positions of the individual observations as they move back.
x<-c abline="" c="" each="40)" g="" histdata-.25="" histdata-.5="" histdata-.75="" histdata="" pch="|" rep="" stripchart="" v="(2:5),col=6,lty=3)</pre" x="">


end edit
Religion in its purest form... is a vast work of bunkum
Dana at En Tequila Es Verdad discusses an interview in Salon with James Carse.
He (Carse) condemns Richard Dawkins and Sam Harris for not being "historians or scholars of religion" and so "it's too easy for them to pass off a quick notion of what religion is."
This is a common argument; PZ called it the "Courtiers Reply". The fact is, when atheists engage with less sophisticated versions of religion, they're doing it because that's what people believe. Was Dawkins' aim to engage with esoteric, sophisticated versions of religious belief? No. Indeed, it's a pointless effort, because the apologist can simply keep moving their goalposts, and refusing to pin down exactly what it is they would expect the atheist to engage with. Carse's difficulty in defining religion in the interview is a case in point.
What these atheists do is argue with veiws on religion that people actually hold.
My first thought on reading this was "he's got a double standard there - he's not asking Christians to study sophisticated versions of other religions, to be historians or scholars of religion before they reject other religions".
But actually, what made me write this is that I realized it's worse than this. There's an even worse double standard.
Carse says:
"To be an atheist, you have to be very clear about what god you're not believing in. Therefore, if you don't have a deep and well-developed understanding of God and divine reality, you can misfire on atheism very easily."
Apparently, the meaning of atheism is lost on him, since, of course, we lack belief in any gods (unless gods are defined so weakly that the term becomes, essentially, pointless).
That's funny, because Carse is apparently attempting "to find some underlying unity to all religions".
His understanding of atheism is laughable. He also says:
"To be an atheist is not to be stunned by the mystery of things or to walk around in wonder about the universe."
So while he berates atheists for failing to have the sophisticated understanding that would come from being an historian and religious scholar, he can't even do us the courtesy of engaging with an everyday relatively unsophisticated version of atheism. Instead, he makes up his version of atheism out of whole straw.
That's an astounding double standard.
Sunday, July 20, 2008
Fighting Mathiness
'I know what you're thinking about,' said Tweedledum: 'but it isn't so, nohow.'
'Contrariwise,' continued Tweedledee, 'if it was so, it might be; and if it were so, it would be; but as it isn't, it ain't. That's logic.'
'Can you do Addition?' the White Queen asked. 'What's one and one and one and one and one and one and one and one and one and one?'
'I don't know,' said Alice. 'I lost count.'
'She can't do Addition,' the Red Queen interrupted. 'Can you do Subtraction? Take nine from eight.'
'Nine from eight I can't, you know,' Alice replied very readily: 'but-'
'She can't do Subtraction,' said the White Queen. 'Can you do Division? Divide a loaf by a knife-what's the answer to that?'
Jordan Ellenberg defined mathiness as "a series of fervent gestures that gives the impression that mathematical ideas are being expressed, but doesn’t actually deliver the goods".
Let us examine some examples of mathiness, and some examples where honest attempts to deal with mathematical situations have foundered, and try to understand how we can be led astray by mathematical arguments.
Skewness
I recently wrote about how in statistics, the measure that is often called skewness doesn't really mean what popular lore holds it to mean, and that it is often misused - for example, when people assert that zero skewness implies symmetry. I later pointed to several sites that made the kinds of errors I was talking about. In the brief time since then, new instances of the same issue have come up on some mathematics-related blogs. It's a case where the verbal "description" of the situation is not in agreement with the mathematical tools being used - mathematical ideas appear to be expressed, but the goods are not being delivered.
Misleading Graphics
In another vein, bad statistical graphics, such as this

lie in graphical form
can mislead us, whether by accident, or as in this case, by design.
(via Andrew Gelman at Statistical Modeling, Causal Inference, and Social Science; there's other good examples to be found there.)
Examples abound in the media. Here's one from the NYT (via the Gallery of Data Visualization’s Missed Opportunities and Graphical Failures - click image for bigger version):

The top plot there is a graph of happiness against GNP-per-capita for a number of countries. The NYT has circled the countries in the top left hand corner, noting that many countries "had higher ... happiness than their economic situation would predict". This is the cardinal sin of treating inherently nonlinear relationships as linear - as they point out at the Gallery, an appropriate transformation - in this case looking at log-GNP, not raw GNP, makes these supposed "outliers" seem much more in keeping with the rest, and the apparent relationship more linear - and indeed, if anything, some entirely different points don't fit the general pattern. We seem to find nearly-linear relationships easier to understand, so transformation is often a useful strategy.
I have discussed the same issues - both the danger of treating nonlinear relationships as linear and the value of transformations in understanding relationships better in another context - relationships involving percentages. It's so easy to fall into the rut of linear thinking that we should consider taking advantage of the tendency to think that way and use transformation to reduce nonlinearity.
A common "nonlinear effect treated as linear" is when people try to average miles per gallon (or miles per hour, or a variety of other rates) - such as "I got 15 mpg going up and 45 mpg coming back, so I averaged 30 mpg overall" (when it's actually 22.5). In terms of transformations - the reciprocal (gallons per mile) - is linear and can be averaged.
Relying on a False Premise
Seemingly mathematical arguments may just be based on bad premises (such as one requiring selecting from the positive integers with equal probability - an impossibility that completely sinks the argument that relies on it).
That "infinity" thingy can be tricky - it seems to cause problems for journalists as well because they tend to underestimate how big it is.
Adding percentiles
Treating percentiles of distributions as if they were additive is unfortunately extremely common. In the case of official estimates of total oil reserves, it means that we probably have a fair bit more oil that we think.
What's the square root of that?
Or, sometimes, it seems, mathiness comes in because someone has no clue what the heck they're talking about, so we can be told that the Maya knew how to take the square root of a rectangle.
Mathematical arguments can feel unsually convincing, even unassailable, and we're awash in them for precisely that reason. It's too easy to forget that just because something seems to be laid out mathematically, it's not necessarily true - or even meaningful at all. Mathiness, like truthiness, is all around us. Even among skeptics, it's possible to put too much store in an argument couched in mathematical terms. We should be at least as skeptical of mathematical arguments - and in basically the same kinds of ways - as any other kinds of arguments, because we're all too often misled by them.
Unfortunately, it seems that we sometimes accept the (often implicit) conclusions of a mathematical argument without even realizing that an argument was being made.
If we fail to treat these arguments with the skepticism they deserve, we're open to being deceived by charlatans.
Friday, July 18, 2008
Well duh.
Natural selection may not produce the best organisms
(Note that so far I've only read the "press-release" news item at this link so far, not the original paper yet.)
"While natural selection favors the most fit organisms around, evolutionary biologists have long wondered whether this leads to the best possible organisms in the long run.
A team of researchers at The University of Texas at Austin, led by Drs. Matthew Cowperthwaite and Lauren Ancel Meyers, has developed a new theory, which suggests that life may not always be optimal."
So... a sequence of local optimizations doesn't necessarily lead to a global optimum?
To anyone who's ever done any optimization, this is completely obvious (it happens all the time!). That's not to say that it's not useful to confirm a pretty well-known fact about optimization in this particular situation - but the way the story is worded, it kind of sounds like they expected different.
I guess this is another of those "try to make every bit of science news sound like a revolutionary breakthrough", as though just plain interesting science is somehow insufficient. If I can get time to read the paper, I will return and write some more.
Wednesday, July 16, 2008
Right to peaceful protest - upheld
A major part of the NSW government's special WYD laws that had many in the local blogging community up in arms has been overturned.
Two activists have taken the state government to the Federal court over the recently passed World Youth Day laws. Their argument that the laws were unconstiutional because they made peaceful protest illegal was upheld, in part because the definition of "annoy" was potentially too broad.
(Their other claim - that banning the unauthorised sale of items such as stickers, badges and T-shirts, was unconstitutional - was not upheld.)
Sunday, July 13, 2008
The cracker controversy
Over at Intrinsically Knotted, musesusan has a discussion of the blow up over PZ's response (et seq.) to the cracker thing that I broadly agree with.
(Er, I mean that I agree with musesusan. That sentence needs emergency surgery, stat!)
We don't have a right to avoid offense - it's under our own control.
I wouldn't choose to do what PZ did, but the reaction he's getting is nuts.
Either the cracker really is the body of christ or it isn't.
- If it isn't, they're threatening death over a cracker, irrespective of what it symbolizes, and feeling offended over rude treatment of a symbol is one thing, but the pitchforks and torches seem to be making PZ's point for him.
- If it is, most of the complaints seem to be about entirely the wrong thing. We have literal flesh of Jesus, which is consumed by the ton (a billion Catholics times a few grams actually makes many thousands of tons of Jesus flesh every week). Over a year, it's millions of tons of Jesus flesh per year. And a few grams of that might be treated in a disrespectful way by a single nonbeliever. Who is actually harmed by that? Jesus then has a stake in it, but is the flesh consumed by others ruined? If Jesus is real, is the Son of God and is actually recreated in the flesh by the ton every hour, do believers actually have a basis for claiming there's some harm being done? Jesus may have a right to object, in which case he's free to say to PZ "Cut it out, doofus". But apart from a gut response to PZ's gaucheness, what is the deal here?
It seems to me that the responses are much more consistent with the first situation than the second - many of the responses indicate that the problem is people fear that PZ may be right. If the cracker really is the flesh of Jesus, where's the need for death threats? No, the severe over-reaction comes because maybe it isn't. That's where that savage fury comes from - because if PZ successfully treats a cracker disrespectfully, and Jesus doesn't come down and ask him to quit it, maybe it is just a cracker. That's what makes it so scary.
(I wrote a related essay on religious over-reaction in Fear the Truth.)
Wednesday, July 9, 2008
The Riemann hypothesis - why does it matter?
Mathematicians regard the Riemann hypothesis as very important, not least because a fair number of important theorems have been shown, given the assumption that the Riemann hypothesis is correct, so as soon as it's shown to be true, a whole pile of other interesting stuff is also true. Its impact is both practical and theoretical.
But when I was talking to William earlier today, he summed it up well:
"If it isn't true, math is a lot weirder than we think it is."
[Oh, and in case you are wondering what the situation with Li's proof is - while I was away on vacation for a few days, the paper was withdrawn. It appears Li could not rescue the proof. ]
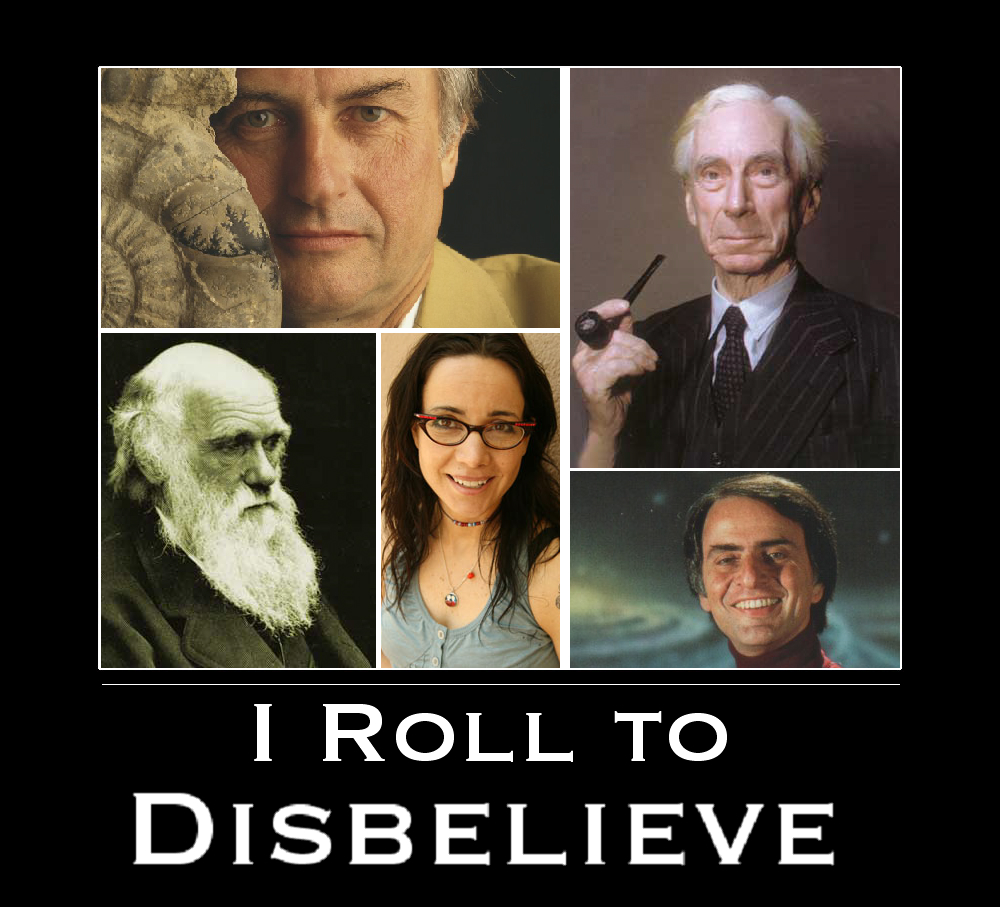
Motivational poster
My 'net friend William has made a motivational poster.

(Click image
for larger
original)
Can you name them all?
(Click image
for larger
original)
Can you name them all?
Sunday, July 6, 2008
"Quantum computers will be better than..."
ordinary computers programmed by publicists or reporters.
The story I linked to yesterday on a quantum computing development says this:
That's just stupid. The phonebook is in order for a start. So at worst, you'd use a binary search (but there are better things to do than that). That's already "exponentially better" (using their own words).
The story I linked to yesterday on a quantum computing development says this:
If a traditional computer were given the task of looking up a person's phone number in a telephone book, it would look at each name in order until it found the right number.
That's just stupid. The phonebook is in order for a start. So at worst, you'd use a binary search (but there are better things to do than that). That's already "exponentially better" (using their own words).
Saturday, July 5, 2008
Science and other news
From the last week or so:
Possible evidence of life from 4.25bya trapped in zircon crystals from Western Australia
Not just oil: Gallium, iridium, indium, hafnium to run out within a decade
Genetic component to political participation
Viagra-like effect from watermelon
Half of gun deaths are suicides, and suicides are much more likely to occur when a gun is present than not.
Another interesting development along the way to quantum computers.
Three items relating to benefits of drinking coffee:
Caffeine after exercise helps muscles refuel
...helps prevent MS
...and lowers risk of liver cancer
Some pointers for new vistors
I'm getting some hits from people looking for my Faith-based mathematics cartoon and some of my other posts. Cartoon/comic posts are here. Mathematics-related posts are here (also probability, statistics).
A post on believing what you feel in your heart is here.
Other tags are over on the right. I wish I knew how to only display tags that occurred more than twice.
A post on believing what you feel in your heart is here.
Other tags are over on the right. I wish I knew how to only display tags that occurred more than twice.
Friday, July 4, 2008
Manufacturing dissent
Another WYD post.
I agree strongly with Ninglun's point - by so casually tossing aside our freedom to make simple protests, the NSW government has created a much bigger desire to protest.
As it was, there would have been some minor level of at worst moderately disruptive protest (for which there are already sufficient laws for police and officials to rely on), but most people that are irritated by the inconvenience, the gifting of large amounts of supposedly secular government money to support a religious event, the ridiculous attention given to that ludicrous entity the Catholic Church and the equally ludicrous Pope Dorothy* would not have been annoyed enough to even think about actually getting out and protesting.
Now a lot of people are damn annoyed. Result: protests.
Either the government is stupid, or it's a deliberate Bushification tactic. Either way, this is one unhappy puppy.
*(think about it - ruby slippers, visiting the land of Oz - what else am I going to call him? Expect Pope Dorothy in Oz comics if I can get time to do some.)
Don S Davis dead
Don S Davis, 1942-2008
About which I am sad for entirely selfish reasons.
Also, I have had a post in progress about Stargate SG-1 (and religion) since forever. More than six months, anyway. I might bump it up the priority list. But since I am about to go away for a few days, it's unlikely to be topical when I finish.
About which I am sad for entirely selfish reasons.
Also, I have had a post in progress about Stargate SG-1 (and religion) since forever. More than six months, anyway. I might bump it up the priority list. But since I am about to go away for a few days, it's unlikely to be topical when I finish.
Riemann not proved. Not yet, anyway.
Well, I was right, there are holes (no prizes for making an obvious guess).
Isabel reports on it; I can't do better than direct you to her links, where Terry Tao and Alain Connes discuss problems.
Tao said: "It unfortunately seems that the decomposition claimed in equation (6.9) on page 20 of that paper is, in fact, impossible; it would endow the function h (which is holding the arithmetical information about the primes) with an extremely strong dilation symmetry which it does not actually obey. It seems that the author was relying on this symmetry to make the adelic Fourier transform far more powerful than it really ought to be for this problem."
Connes said: "I dont like to be too negative in my comments. Li's paper is an attempt to prove a variant of the global trace formula of my paper in Selecta. The "proof" is that of Theorem 7.3 page 29 in Li's paper, but I stopped reading it when I saw that he is extending the test function h from ideles to adeles by 0 outside ideles and then using Fourier transform (see page 31). This cannot work and ideles form a set of measure 0 inside adeles (unlike what happens when one only deals with finitely many places)."
Thursday, July 3, 2008
Riemann proved??
A Proof of the Riemann Hypothesis by Xian-Jin Li. (link now fixed)
This is no crackpot. He's a mathematician who has his PhD in the right area.
I am not qualified (in the sense that I havenolittle* familiarity with this area of mathematics) to judge, but the mathematical world will be all over this one. [* Edit: well, actually, having read through it, it doesn't look to be as tough a paper as I first thought. I can understand some of it. I expect this claimed result will be either confirmed or disconfirmed in short order. If it's right, I suspect that it can be made even simpler (and if its wrong, it can be made as simple as you like!)]
My guess as an outsider... it will probably turn out to have a few holes in it. But if he's claiming it, he's probably really got something; if it's not there yet, it will probably turn out to be an important step, and if the holes are small, they'll be plugged soon enough. The fact that its a short paper increases the chance that Li hasn't missed something.
h/t Isabel Lugo
This is no crackpot. He's a mathematician who has his PhD in the right area.
I am not qualified (in the sense that I have
My guess as an outsider... it will probably turn out to have a few holes in it. But if he's claiming it, he's probably really got something; if it's not there yet, it will probably turn out to be an important step, and if the holes are small, they'll be plugged soon enough. The fact that its a short paper increases the chance that Li hasn't missed something.
h/t Isabel Lugo
Wednesday, July 2, 2008
Hundredth post
100 is a bit of a milestone, so I figured I'd mark it.
I'm reasonably happy how this blog has come along, and I'm glad some people are reading it.
A few months ago I started using sitemeter to track my visits. The first weekly report I got had my average visit length at two seconds. Most people who made it to my site were finding me through google searches, not finding what they were expecting, and hotfooting it back to safer pages.
Nowadays, the average visit length is about two minutes - long enough to read a short post or two. The average page views is 1.6 - so a lot of people are sticking around to look at more of my site.
I'm getting hits from all over - a post I made on percentages has proved to be incredibly popular, giving me sustained traffic for a month. Some of my comics got linked to from several places. Some posts in carnivals have netted me some good hits, and in particular when PZ mentions the Carnival of the Elitist Bastards, there's always a nice bump. Comments in other blogs often grab a few visits.
Since I started with sitemeter (the earliest date I can tell for sure), I've been better than doubling visits and page views every month... except last month, when my hits nearly quadrupled over the month before. In July I don't think I'll beat last month (I'll have even less time to post), but it looks like there might be a good chance of keeping up close to the hit rate on the days I can post.
A warning: I have been sick this week, which has cut down on the posting, and next week I will be away several days (and so not posting at all). So posts will be shorter, and less frequent over the next week or so. If you don't see posts, I haven't died or anything.
Nobility must be earned
A random post.
Annoyance #99:
My state government has a "don't offend the Catholics" law in place. I have to fork over *lots* of my hard earned cash (via the government) to support the stupidly-named World Youth Day (a lovely little convention where altar boys from all over the world can compare their sodomization stories), and I can't even wear a FUCK THE POPE T-shirt?
Well, fuck the pope and this government.
Next election, if I have to vote for those fetid arsewipe Libs in order to get rid of this lot, I will; of course, I'd vote against them next time around - maybe giving the current mob a few years in opposition will do some good. This mob has been in too long, and the Liberals don't stink quite so much just now. It would make me puke just to vote for them, but if I'm going to puke either way, it might as well be in the service of getting some new blood into the government.
Who knows, maybe the Libascists can get the trains running on time.
[Aside added in later edit]: More on WYD over at The Thinkers Podium.
Maybe I need a T-shirt like this.
Something like this - the second part shows what it would look like if I put a bit of tape over the middle, rather than folding it. It's a bit subtler, I think:

Now, to be really subtle, just have the first line and cover the bottom half. If they read something into that, well, that's their own evil mind, innit?
More T-shirts at Five Public Opinions
[end of edit]
On an almost completely unrelated matter, PZed said:
I'd like to put that on a t-shirt. Except the pope would be offended and I'll be out $5500 and get strip-searched.
Annoyance #99:
My state government has a "don't offend the Catholics" law in place. I have to fork over *lots* of my hard earned cash (via the government) to support the stupidly-named World Youth Day (a lovely little convention where altar boys from all over the world can compare their sodomization stories), and I can't even wear a FUCK THE POPE T-shirt?
Well, fuck the pope and this government.
Next election, if I have to vote for those fetid arsewipe Libs in order to get rid of this lot, I will; of course, I'd vote against them next time around - maybe giving the current mob a few years in opposition will do some good. This mob has been in too long, and the Liberals don't stink quite so much just now. It would make me puke just to vote for them, but if I'm going to puke either way, it might as well be in the service of getting some new blood into the government.
Who knows, maybe the Libascists can get the trains running on time.
[Aside added in later edit]: More on WYD over at The Thinkers Podium.
Maybe I need a T-shirt like this.
Something like this - the second part shows what it would look like if I put a bit of tape over the middle, rather than folding it. It's a bit subtler, I think:

Now, to be really subtle, just have the first line and cover the bottom half. If they read something into that, well, that's their own evil mind, innit?
More T-shirts at Five Public Opinions
[end of edit]
On an almost completely unrelated matter, PZed said:
We are not princes of the earth, we are the descendants of worms, and any nobility must be earned.
I'd like to put that on a t-shirt. Except the pope would be offended and I'll be out $5500 and get strip-searched.
Subscribe to:
Posts (Atom)


